Zipkin integration
Table of contents
If you want to troubleshoot latency problems in microservice architecture, you will want to use distributed tracing system such as Zipkin. It gathers timing data and shows which component is failing or taking more time than others in a distributed environment. Armeria supports distributed tracing via Brave, which is a Java tracing library compatible with Zipkin. Let's find out how to use it to trace requests.
First, You need the armeria-brave dependency:
dependencies {
    implementation platform('com.linecorp.armeria:armeria-bom:1.29.3')

    ...
    implementation 'com.linecorp.armeria:armeria-brave'
}
Then, you need to create the HttpTracing:
import com.linecorp.armeria.common.brave.RequestContextCurrentTraceContext;

import brave.Tracing;
import brave.http.HttpTracing;
import zipkin2.reporter.brave.AsyncZipkinSpanHandler;

AsyncZipkinSpanHandler spanHandler = ...
Tracing tracing = Tracing.newBuilder()
                         .localServiceName("myService")
                         .currentTraceContext(RequestContextCurrentTraceContext.ofDefault())
                         .addSpanHandler(spanHandler)
                         .build();
HttpTracing httpTracing = HttpTracing.create(tracing);
Please note that we specified RequestContextCurrentTraceContext. It stores the trace context into a
RequestContext and loads the trace context from the RequestContext automatically. Because of that,
we don't need to use a thread local variable which can lead to unpredictable behavior in asynchronous
programming. If you want to send timing data to the span collecting server, you should specify spanHandler.
For more information about the spanHandler, please refer to
Zipkin Reporter Brave or
the fully working example.
Now, you can specify BraveService using Decorating a service with the
HttpTracing you just built:
import com.linecorp.armeria.common.HttpResponse;
import com.linecorp.armeria.server.Server;
import com.linecorp.armeria.server.brave.BraveService;

Tracing tracing = ...
Server server = Server.builder()
                      .http(8081)
                      .service("/", (ctx, res) -> HttpResponse.of(200))
                      .decorator(BraveService.newDecorator(httpTracing))
                      .build();
If the requests come to Armeria server and go to another backend, you can trace them using
BraveClient:
import com.linecorp.armeria.client.WebClient;
import com.linecorp.armeria.client.brave.BraveClient;
import com.linecorp.armeria.server.brave.BraveService;

Tracing tracing = ...
WebClient client = WebClient
        .builder("https://myBackend.com")
        .decorator(BraveClient.newDecorator(httpTracing.clientOf("myBackend")))
        .build();

Server server = Server.builder()
                      .http(8081)
                      .service("/", (ctx, res) -> client.get("/api"))
                      .decorator(BraveService.newDecorator(httpTracing))
                      .build();
Please note that our HttpTracing instance used the same Tracing instance when we
create BraveClient and BraveService. Otherwise, there might be problems if the instances are not
configured exactly the same.
In the same manner, you can use the Tracing instance with any
Brave instrumentation libraries.
For example, you can use it with Kafka producer:
import org.apache.kafka.clients.producer.KafkaProducer;
import org.apache.kafka.clients.producer.Producer;
import org.apache.kafka.clients.producer.ProducerRecord;

import brave.kafka.clients.KafkaTracing;

Tracing tracing = ...
KafkaTracing kafkaTracing = KafkaTracing.newBuilder(tracing)
                                        .remoteServiceName("backend")
                                        .writeB3SingleFormat(true)
                                        .build();

Properties props = new Properties();
props.put("bootstrap.servers", "https://myKafka.com");
props.put("acks", "all");
...

Producer<String, String> kafkaProducer = kafkaTracing.producer(new KafkaProducer<>(props));

Server server = Server.builder()
                      .http(8081)
                      .service("/", (ctx, req) -> {
                          kafkaProducer.send(new ProducerRecord<>("test", "foo", "bar"));
                          return HttpResponse.of(200);
                      })
                      .decorator(BraveService.newDecorator(tracing))
                      .build();
This will trace all the requests sent from the client to the above example server to
Kafka, and report timing data using the spanHandler you specified.
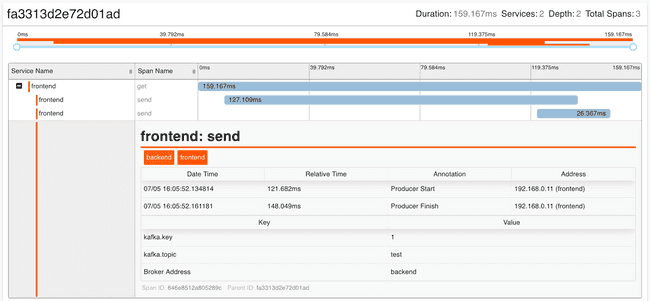
The following screenshot shows a trace of a request:
