This post is also available in English.
Armeria에서 Prometheus 지표 모니터링하기

시작하며
이번 글에서는 Armeria에서 수집한 Prometheus 지표를 모니터링하는 방법을 살펴보겠습니다. Armeria를 처음 사용해 보시는 분들도 쉽게 따라 할 수 있도록 간단한 실습 예제와 함께 작성했습니다.
실습
실습은 macOS Big Sur 환경에서 진행했습니다. 실습을 진행하기 위해 Gradle과 Prometheus, Grafana를 어떻게 설치하고 설정했는지 함께 알아보고, 테스트 결과를 확인해보겠습니다.
Gradle 설정
Armeria 서버의 Prometheus 지표를 수집하기 위해 'build.gradle' 파일에 아래와 같은 디펜던시를 정의했습니다.
dependencies {

    // Armeria
    implementation "com.linecorp.armeria:armeria:1.8.0"
    implementation "com.linecorp.armeria:armeria-logback:1.8.0"

    // Prometheus
    implementation "io.micrometer:micrometer-registry-prometheus:1.7.0"

    // ...
}
또한 실습을 위해 아래와 같이 /hello/{seq}로 GET 요청을 전송하면 성공 혹은 실패로 응답하는 간단한 REST API를 하나 준비했습니다.
public class MyAnnotatedService {

    @Get("/hello/{seq}")
    public HttpResponse hello(@Param("seq") int seq) {
        if (seq % 3 == 0) {
            return HttpResponse.of(HttpStatus.INTERNAL_SERVER_ERROR);
        }
        return HttpResponse.of(HttpStatus.OK, MediaType.PLAIN_TEXT_UTF_8, "Success");
    }
}
아래는 Armeria 서버를 실행하기 위한 main() 함수 코드입니다.
public class ArmeriaPrometheusApplication {

    public static void main(String[] args) {
        PrometheusMeterRegistry meterRegistry = new PrometheusMeterRegistry(PrometheusConfig.DEFAULT);
        Server server = Server
                .builder()
                .http(8083)
                .meterRegistry(meterRegistry)
                .annotatedService(new MyAnnotatedService())
                .service("/metrics", PrometheusExpositionService.of(meterRegistry.getPrometheusRegistry()))
                .decorator(MetricCollectingService.builder(MeterIdPrefixFunction.ofDefault("my.http.service"))
                                                  .newDecorator())
                .build();

        CompletableFuture<Void> future = server.start();
        future.join();
    }
}
서비스 지표를 수집하기 위해서는 반드시 아래와 같이 MetricCollectingService를 decorator로 추가해야 합니다(자세한 방법은 공식 문서를 참고하시기 바랍니다). MeterIdPrefixFunction.ofDefault() 함수의 인자 값을 이용하면 지표의 기본 프리픽스 이름을 원하는 대로 설정할 수 있습니다.
.decorator(new MyAnnotatedService(),
           MetricCollectingService.builder(MeterIdPrefixFunction.ofDefault("my.http.service"))
                                  .newDecorator())
PrometheusExpositionService를 이용해 Prometheus 지표를 노출할 경로를 설정합니다.
.service("/metrics", PrometheusExpositionService.of(meterRegistry.getPrometheusRegistry()))
/hello API를 요청해 응답이 잘 오는지 확인합니다.
$ curl http://localhost:8083/hello/1
Success

$ curl http://localhost:8083/hello/3
500 Internal Server Error
/metrics로 요청했을 때 Prometheus 지표가 응답으로 잘 전달되는지도 확인합니다.
$ curl -s http://localhost:8083/metrics | grep "my_http_service_requests_total"
# HELP my_http_service_requests_total
# TYPE my_http_service_requests_total counter
my_http_service_requests_total{hostname_pattern="*",http_status="500",method="hello",result="success",service="com.example.armeria_prometheus.MyAnnotatedService",} 0.0
my_http_service_requests_total{hostname_pattern="*",http_status="200",method="hello",result="failure",service="com.example.armeria_prometheus.MyAnnotatedService",} 0.0
my_http_service_requests_total{hostname_pattern="*",http_status="200",method="hello",result="success",service="com.example.armeria_prometheus.MyAnnotatedService",} 1.0
my_http_service_requests_total{hostname_pattern="*",http_status="500",method="hello",result="failure",service="com.example.armeria_prometheus.MyAnnotatedService",} 1.0
Prometheus 설치 및 설정
먼저 Homebrew 패키지 매니저로 Prometheus를 설치합니다.
$ brew install prometheus
설치가 완료되면 기본적으로 'prometheus.yml'이라는 파일이 하나 생성됩니다. 이 YAML 파일을 이용해 Prometheus 설정을 변경할 수 있습니다.
$ vi $(brew --prefix)/etc/prometheus.yml
설정 파일에 Prometheus 지표를 수집할 수 있는 경로와 포트를 정확하게 기입합니다.
global:
  scrape_interval: 10s

scrape_configs:
  - job_name: 'armeria-prometheus'
    metrics_path: '/metrics'
    static_configs:
      - targets: ['localhost:8083']
변경한 후에 Prometheus 서비스를 재시작해야 변경된 설정이 적용됩니다.
$ brew services start prometheus
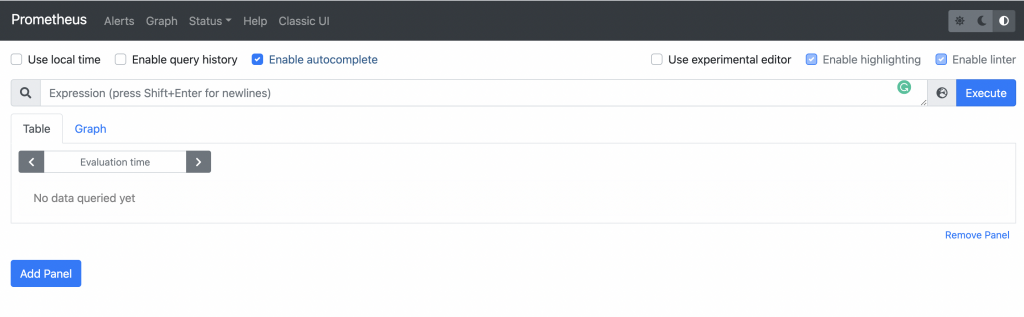
Prometheus가 사용하는 기본 포트는 9090입니다. 웹 브라우저에서 http://localhost:9090 주소로 접속하면 아래 화면을 볼 수 있습니다.
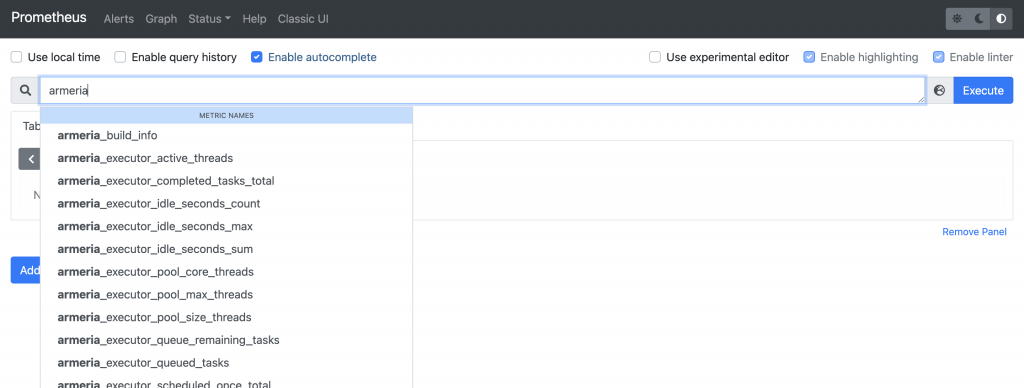
셀렉트 박스를 클릭해 Armeria 관련 지표가 Prometheus 서버에서 잘 수집됐는지 확인합니다.
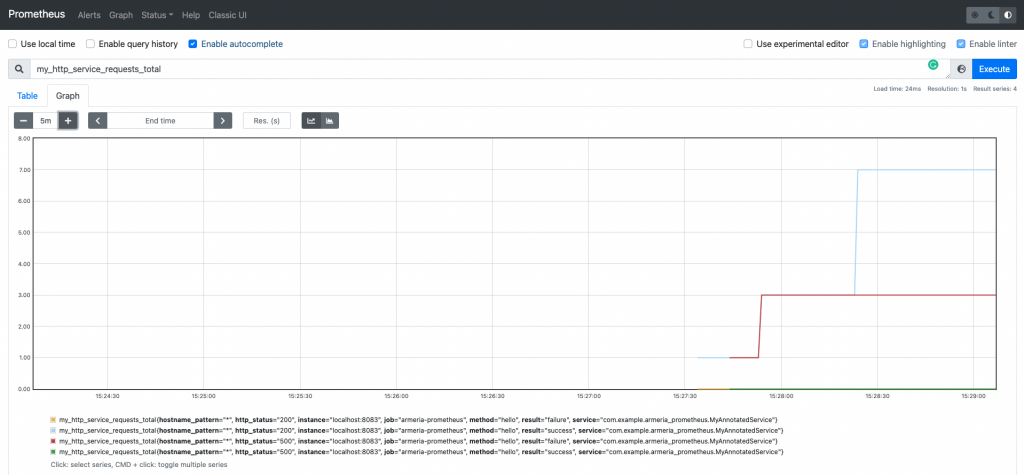
/hello/{seq} API를 몇 번 요청한 뒤 my_http_service_requests_total 지표가 잘 증가하는지 그래프에서 확인합니다.
Grafana 설치 및 설정
Prometheus와 마찬가지로 Grafana도 Homebrew로 설치한 후 서비스를 시작합니다.
$ brew install grafana
$ brew services start grafana
Grafana의 기본 포트는 3000입니다. 브라우저에서 http://localhost:3000 주소로 접속하면 아래 로그인 페이지를 만나게 됩니다.

'계정을 만든 적이 없는데...?'라고 당황하지 마시고 침착하게 Email or username과 Password에 'admin'을 입력하면 로그인할 수 있습니다. 이름에서 알 수 있듯이 admin은 기본 계정이므로 실제 서비스에서 사용할 때는 보안을 위해 반드시 계정을 새로 만들어야 합니다.
Grafana에서 Prometheus 메트릭을 그래프로 표시할 수 있도록, 앞에서 설정한 Prometheus 경로를 Data Source로 추가해야 합니다.
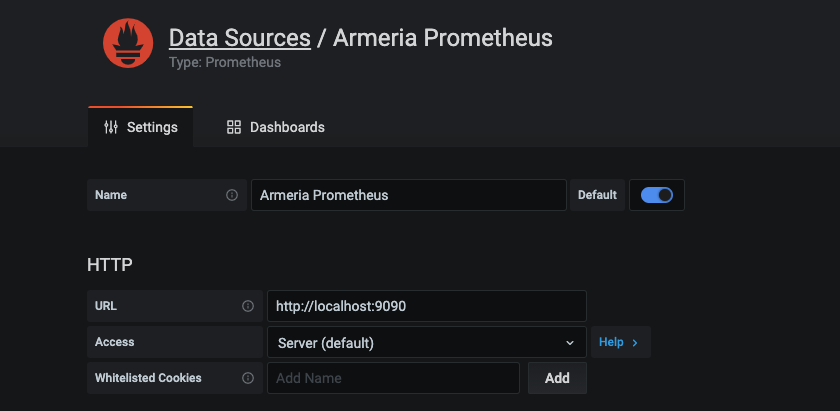
다음으로 대시보드를 하나 생성한 후, /hello/{seq} API의 성공과 실패 횟수를 모니터링할 수 있는 패널을 하나 생성하겠습니다.
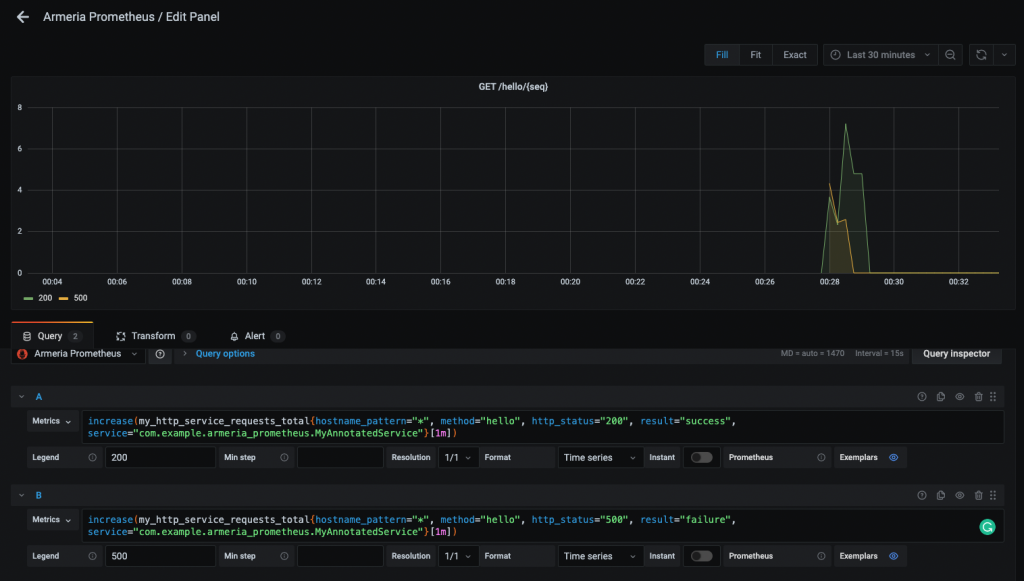
쿼리는 아래와 같이 작성했습니다.
- 200:
increase(my_http_service_requests_total{hostname_pattern="*", method="hello", http_status="200", result="success", service="com.example.armeria_prometheus.MyAnnotatedService"}[1m]) - 500:
increase(my_http_service_requests_total{hostname_pattern="*", method="hello", http_status="500", result="failure", service="com.example.armeria_prometheus.MyAnnotatedService"}[1m])
여기서 armeria_server_requests_total 지표는 Counter라는 지표 유형으로 단순히 누적되며 계속 증가하는 값입니다. 실제 API 모니터링에서는 이 API가 현재까지 얼마나 많이 성공 혹은 실패했느냐는 누적값보다는, 시간별 성공과 실패 횟수가 더 의미 있을 것입니다. 이에 increase() 함수를 사용해서 매 1분 동안의 성공과 실패 횟수를 그래프로 나타냈습니다.
테스트 결과
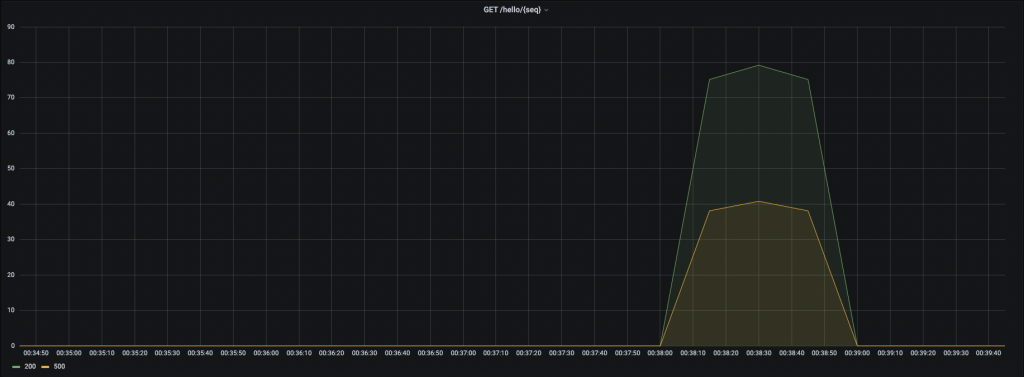
이제 아래 클라이언트 코드를 실행해 API 요청을 100번 보내겠습니다(Armeria의 WebClient를 사용했습니다).
public class HttpClientApplication {

    private static final Logger logger = LoggerFactory.getLogger(HttpClientApplication.class);

    public static void main(String[] args) {
        WebClient client = WebClient.of("http://localhost:8083/");
        for (int i = 0; i < 100; i++) {
            AggregatedHttpResponse res = client.get("/hello/" + i).aggregate().join();
            logger.info(res.content(StandardCharsets.UTF_8));
        }
    }
}
Grafana에서 /hello/{seq} API의 성공과 실패 횟수가 아름답게 그래프로 표시되는 것을 확인할 수 있습니다.
마치며
이번 글에서는 Armeria 서버를 실행해서 수집한 Prometheus 지표와 Grafana 대시보드를 이용해 모니터링하는 방법을 살펴보았습니다. Armeria에서는 현재 지표 수집과 관련한 다양한 기능을 제공하고 있습니다. 다음 글에서는 이 기능을 이용해 Armeria에서 수집된 지표를 내 입맛에 맞게 커스터마이징해 보겠습니다.